Elastic EDR
Table of content
Install
wget -qO - https://artifacts.elastic.co/GPG-KEY-elasticsearch | sudo apt-key add -
sudo apt-get install apt-transport-https
echo "deb https://artifacts.elastic.co/packages/8.x/apt stable main" | sudo tee -a /etc/apt/sources.list.d/elastic-8.x.list
Elastic search
apt-get install elasticsearch
In /etc/elasticsearch/elasticsearch.yml :
- Set the
network.hostvalue with the serverIPaddress - Give name to your nodes with
node.nameandcluster.initial_master_nodes
Then restart elastic:
service elasticsearch start
service elasticsearch status
Reset the elastic password :
/usr/share/elasticsearch/bin/elasticsearch-reset-password -u elastic
Kibana
apt-get install kibana
In /etc/kibana/kibana.yml:
- Set the
server.hostvalue with the serverIPaddress - Set the
elasticsearch.hostsvalue with theelasticsearchIP
Restart Kibana:
service kibana start
Beats
apt install filebeat
X-PACK
X-PACK is used to handle SSL and security parameters.
Generate certificates
Create the /usr/share/elasticsearch/instances.yml file with the following content:
instances:
    - name: "elasticsearch"
      ip:
        - "192.168.253.18"
    - name: "kibana"
      ip:
        - "192.168.253.18"
    - name: "zeek"
      ip:
        - "192.168.253.18"
Generate the AC certificate with :
bin/elasticsearch-certutil ca -pem
Generate the instances certificates with:
bin/elasticsearch-certutil cert -ca-cert ca/ca.crt -ca-key ca/ca.key -pem -in instances.yml --out certs.zip
Where ca.key and ca.crt are the AC certificate generated before.
Copy the certificates in the elasticsearch, kibana and beats directories:
unzip certs.zip

mkdir -p /etc/elasticsearch/certs
mv elasticsearch/* /etc/elasticsearch/certs
cp ca/ca.crt /etc/elasticsearch/ca.crt
chown -R elasticsearch: /etc/elasticsearch/certs
chmod -R 770 /etc/elasticsearch/certs

mkdir -p /etc/kibana/certs
mv kibana/* /etc/kibana/certs
cp ca/ca.crt /etc/kibana/ca.crt
chown -R kibana: /etc/kibana/certs
chmod -R 770 /etc/kibana/certs

mkdir -p /etc/filebeat/certs
mv zeek/* /etc/filebeat/certs
cp ca/ca.crt /etc/filebeat/ca.crt
chmod 770 -R /etc/filebeat/certs
Configure SSL
In /etc/elasticsearch/elasticsearch.yml:
# Transport layer
xpack.security.transport.ssl.enabled: true
xpack.security.transport.ssl.verification_mode: certificate
xpack.security.transport.ssl.key: /etc/elasticsearch/certs/elasticsearch.key
xpack.security.transport.ssl.certificate: /etc/elasticsearch/certs/elasticsearch.crt
xpack.security.transport.ssl.certificate_authorities: [ "/etc/elasticsearch/certs/ca.crt" ]

# HTTP layer
xpack.security.http.ssl.enabled: true
xpack.security.http.ssl.verification_mode: certificate
xpack.security.http.ssl.key: /etc/elasticsearch/certs/elasticsearch.key
xpack.security.http.ssl.certificate: /etc/elasticsearch/certs/elasticsearch.crt
xpack.security.http.ssl.certificate_authorities: [ "/etc/elasticsearch/certs/ca.crt" ]
In /etc/kibana/kibana.yml:
# The URLs of the Elasticsearch instances to use for all your queries.
elasticsearch.hosts: ["https://192.168.1.232:9200"]
elasticsearch.ssl.certificateAuthorities: ["/etc/kibana/certs/ca.crt"]
elasticsearch.ssl.certificate: "/etc/kibana/certs/kibana.crt"
elasticsearch.ssl.key: "/etc/kibana/certs/kibana.key"

server.ssl.enabled: true
server.ssl.certificate: "/etc/kibana/certs/kibana.crt"
server.ssl.key: "/etc/kibana/certs/kibana.key"
In /etc/filebeat/filebeat.yml:
# Elastic Output
output.elasticsearch.hosts: ['192.168.1.232:9200']
output.elasticsearch.protocol: https
output.elasticsearch.ssl.certificate: "/etc/filebeat/certs/zeek.crt"
output.elasticsearch.ssl.key: "/etc/filebeat/certs/zeek.key"
output.elasticsearch.ssl.certificate_authorities: ["/etc/filebeat/certs/ca/ca.crt"]

# Kibana Host
host: "https://192.168.1.232:5601"
  ssl.enabled: true
  ssl.certificate_authorities: ["/etc/filebeat/certs/ca/ca.crt"]
  ssl.certificate: "/etc/filebeat/certs/zeek.crt"
  ssl.key: "/etc/filebeat/certs/zeek.key"
Restart the services :
service elasticsearch restart
service kibana restart
service filebeat restart
Authentication
In /etc/elasticsearch/ealasticsearch.yml:
xpack.security.enabled: true
If you don't know the elastic password, just reset it:
/usr/share/elasticsearch/bin/elasticsearch-reset-password -u ${username}
In /etc/kibana/kibana.yml:
# Elastic Credentials
xpack.security.enabled: true
elasticsearch.username: "elastic"
elasticsearch.password: "Your_Elastic_Pass_Here"
In /etc/filebeat/filebeat.yml:
# Elastic Credentials
output.elasticsearch.username: "elastic"
output.elasticsearch.password: "Your_Elastic_Pass_Here"
Restart services:
service elasticsearch restart
service kibana restart
service filebeat restart
Check if filebeat can access to elasticsearch:
filebeat test config
filebeat test output
If one on the service does not start, debug it with :
journalctl -u elasticsearch.service
journalctl -u kibana.service
journalctl -u filebeat.service
Elastic EDR
Enroll an agent
Connect to Kibana on port 5601:
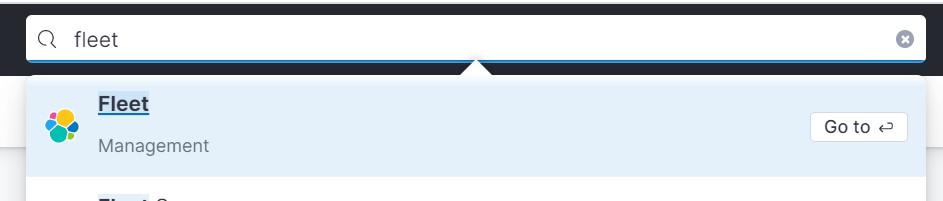
Go to Fleet Management:
Add a new Fleet Server if needed:
- Default
Fleet Server Policy - Quick Start
- Fleet Server Host :
https://${kibanaIP}:8220 - Generate the service token
- Launch the
Fleet servercommand on the host you want to enroll
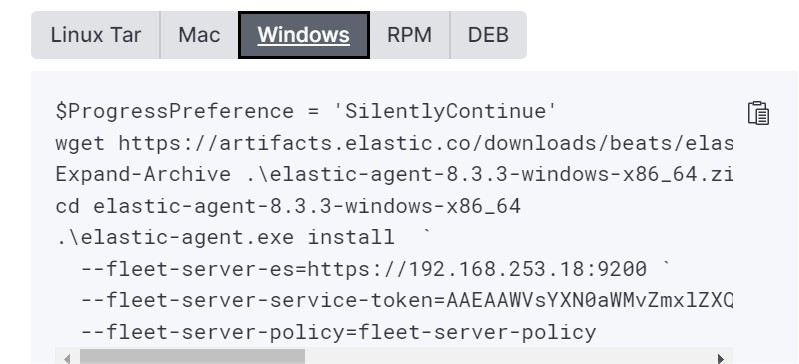
On the command, add the following parameter:
--fleet-server-es-ca=${path}
Where path is the path to the AC ca.crt generated during the ElasticSearch stack deployement.
Likewise, add this certificate in the certificate trust store (Trusted Root Certificate Authority in Windows) and modify the local policy to use the certificate:
Local Security Policy > Public Key Policies > Certificate Path Validation Settings
Set the following parameters:
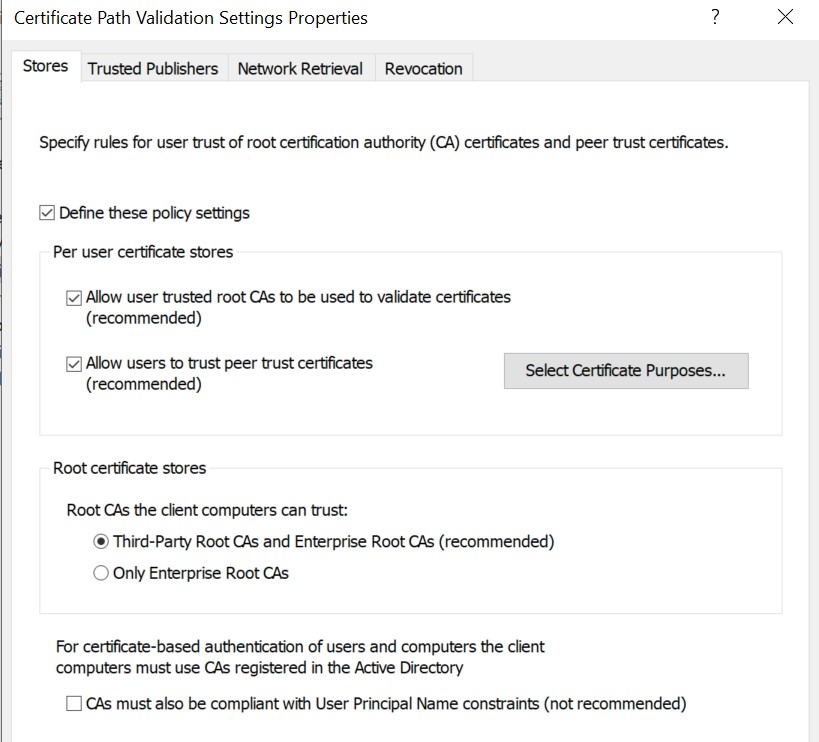
You can launch the command now. The device should be enrolled !
Check if any datastream have been defined in Kibana :
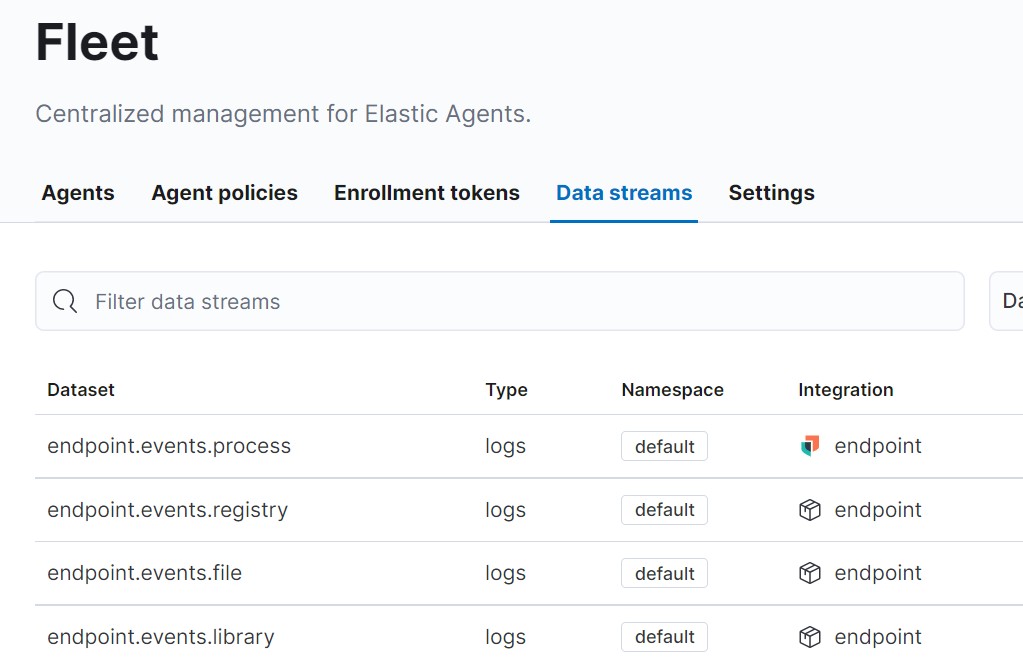
If no datastream are defined there is a communication problem between the agent and the elasticsearch.
Check the log directory in the machine where the agent has been installed and the logs in the elasticsearch server (/var/log/elasticsearch/elasticsearch.log). Usually it is a TLS certificate problem.
Add the EDR
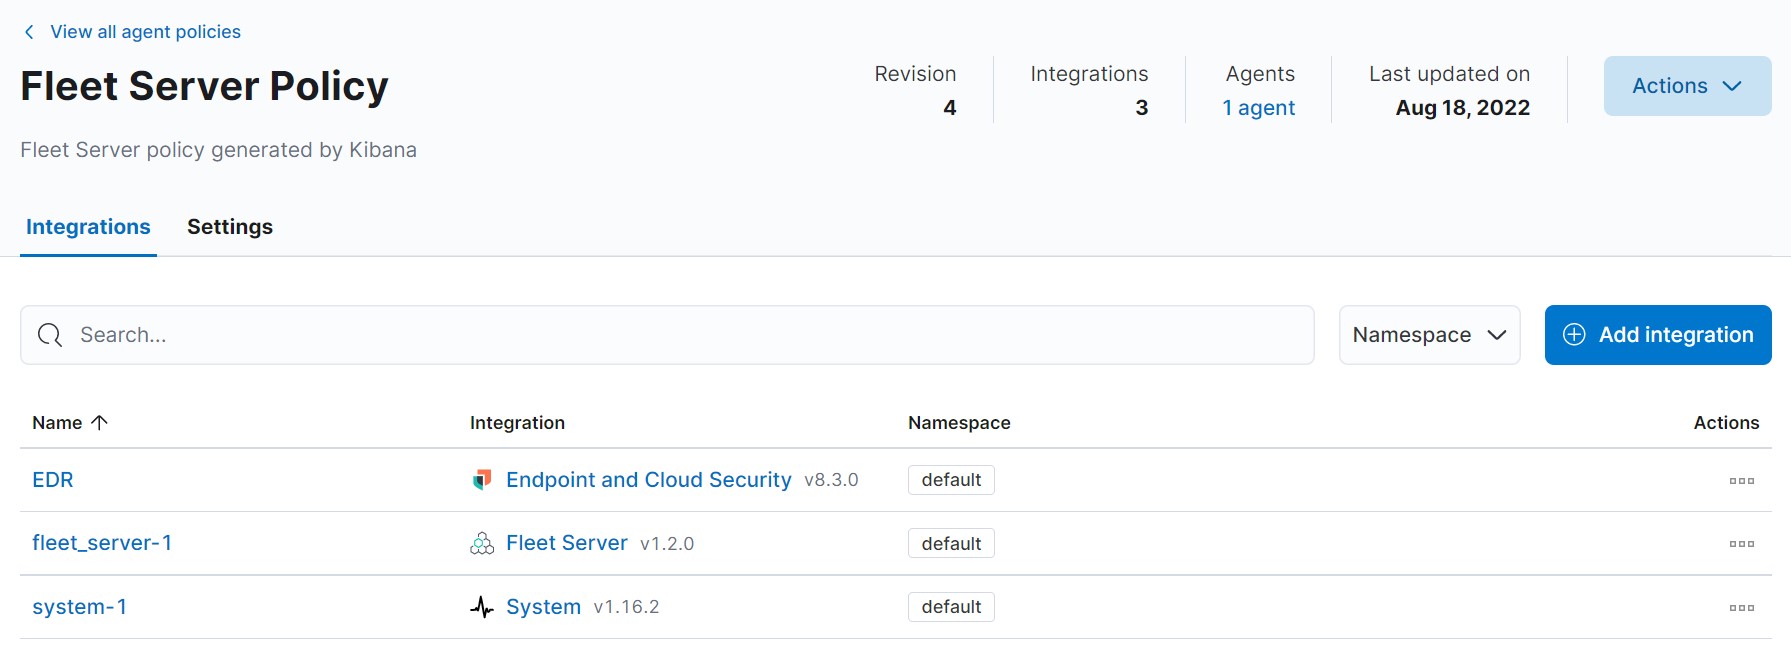
Go to the Fleet agent policy:
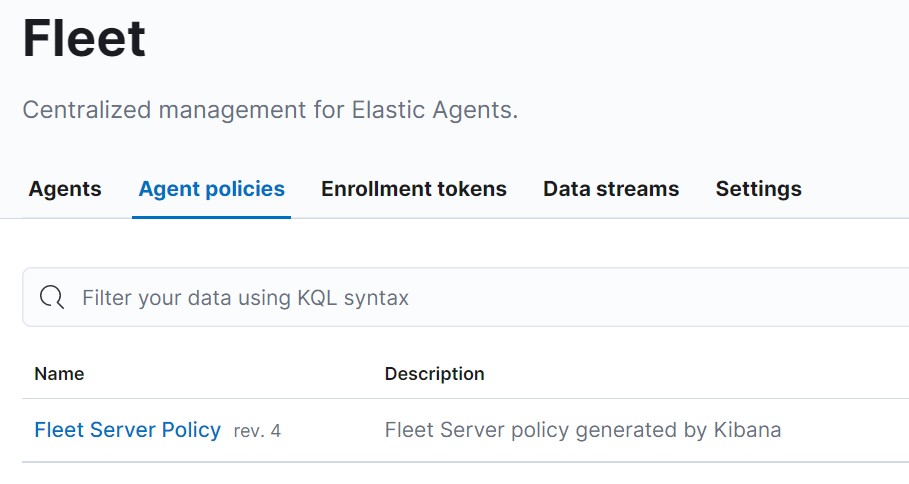
Add an integration with Endpoint And Cloud Security:
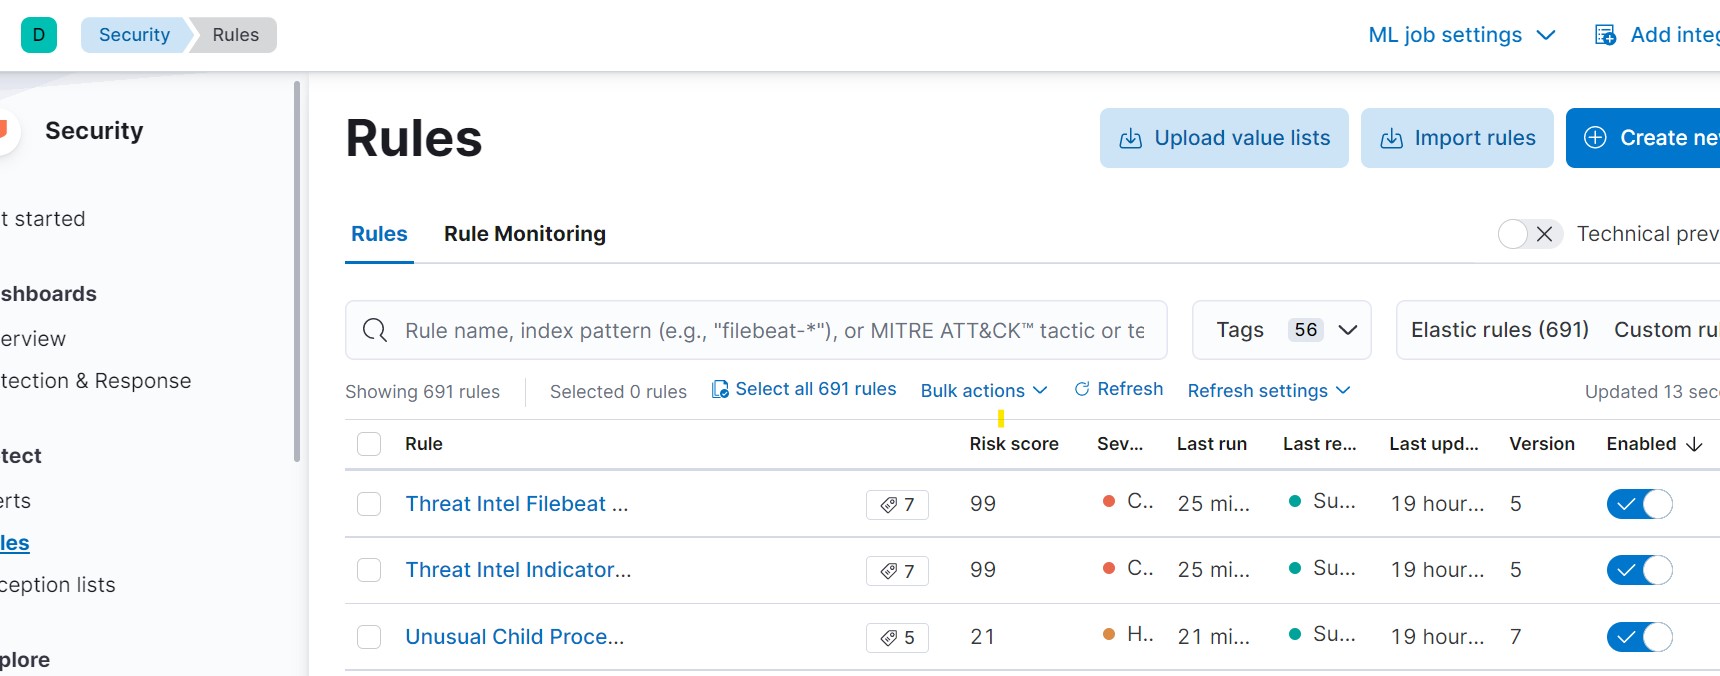
Go to Security > Rules and enable all rules:
Add Sysmon
Sysmon
Download and install sysmon:
Invoke-WebRequest -Uri https://download.sysinternals.com/files/Sysmon.zip -OutFile Sysmon.zip
Expand-Archive .\Sysmon.zip -DestinationPath .
Invoke-WebRequest -Uri https://raw.githubusercontent.com/SwiftOnSecurity/sysmon-config/master/sysmonconfig-export.xml -OutFile ./sysmonconfig.xml
.\Sysmon.exe -accepteula -i .\sysmonconfig.xml
Winlogbeats
Winlogbeats is used to send Sysmon logs to the elastic stack.
Invoke-WebRequest -Uri https://artifacts.elastic.co/downloads/beats/winlogbeat/winlogbeat-7.10.0-windows-x86_64.zip -OutFile winlogbeat-7.10.0-windows-x86_64.zip
Expand-Archive .\winlogbeat-7.10.0-windows-x86_64.zip -DestinationPath .
mv .\winlogbeat-7.10.0-windows-x86_64 'C:\Program Files\winlogbeat'
cd 'C:\Program Files\winlogbeat\'
Open or create the winlogbeat.yml file and add :
winlogbeat.event_logs:
  - name: Application
    ignore_older: 72h

  - name: System
  - name: Microsoft-Windows-Windows Defender/Operational
  - name: Microsoft-Windows-Windows Firewall With Advanced Security/Firewall

  - name: Security
    processors:
      - script:
          lang: javascript
          id: security
          file: ${path.home}/module/security/config/winlogbeat-security.js

  - name: Microsoft-Windows-Sysmon/Operational
    processors:
      - script:
          lang: javascript
          id: sysmon
          file: ${path.home}/module/sysmon/config/winlogbeat-sysmon.js

  - name: Windows PowerShell
    event_id: 400, 403, 600, 800
    processors:
      - script:
          lang: javascript
          id: powershell
          file: ${path.home}/module/powershell/config/winlogbeat-powershell.js

  - name: Microsoft-Windows-PowerShell/Operational
    event_id: 4103, 4104, 4105, 4106
    processors:
      - script:
          lang: javascript
          id: powershell
          file: ${path.home}/module/powershell/config/winlogbeat-powershell.js

  - name: ForwardedEvents
    tags: [forwarded]
    processors:
      - script:
          when.equals.winlog.channel: Security
          lang: javascript
          id: security
          file: ${path.home}/module/security/config/winlogbeat-security.js
      - script:
          when.equals.winlog.channel: Microsoft-Windows-Sysmon/Operational
          lang: javascript
          id: sysmon
          file: ${path.home}/module/sysmon/config/winlogbeat-sysmon.js
      - script:
          when.equals.winlog.channel: Windows PowerShell
          lang: javascript
          id: powershell
          file: ${path.home}/module/powershell/config/winlogbeat-powershell.js
      - script:
          when.equals.winlog.channel: Microsoft-Windows-PowerShell/Operational
          lang: javascript
          id: powershell
          file: ${path.home}/module/powershell/config/winlogbeat-powershell.js
  - name: Microsoft-Windows-WMI-Activity/Operational
    event_id: 5857,5858,5859,5860,5861

setup.template.settings:
  index.number_of_shards: 1

setup.kibana:
  host: "192.168.253.18"
  # protocol: "https"
  # ssl.verification_mode: none

output.elasticsearch:
  # Array of hosts to connect to.
  hosts: ["192.168.253.18:9200"]
  username: "${username}"
  password: "${password}"
  protocol: "https"
  # ssl.verification_mode: none

processors:
  - add_host_metadata:
      when.not.contains.tags: forwarded
  - add_cloud_metadata: ~
Initial configuration:
winlogbeat.exe setup -e
Install the service :
powershell -Exec bypass -File .\install-service-winlogbeat.ps1
Set-Service -Name "winlogbeat" -StartupType automatic
Start-Service -Name "winlogbeat"
Get-Service -Name "winlogbeat"